> ## Documentation Index
> Fetch the complete documentation index at: https://docs.inframap.cloud/llms.txt
> Use this file to discover all available pages before exploring further.
# Cost Analysis
> Track and analyze your AWS costs with detailed breakdowns by resource, service, and region. Identify trends, anomalies, and optimization opportunities.
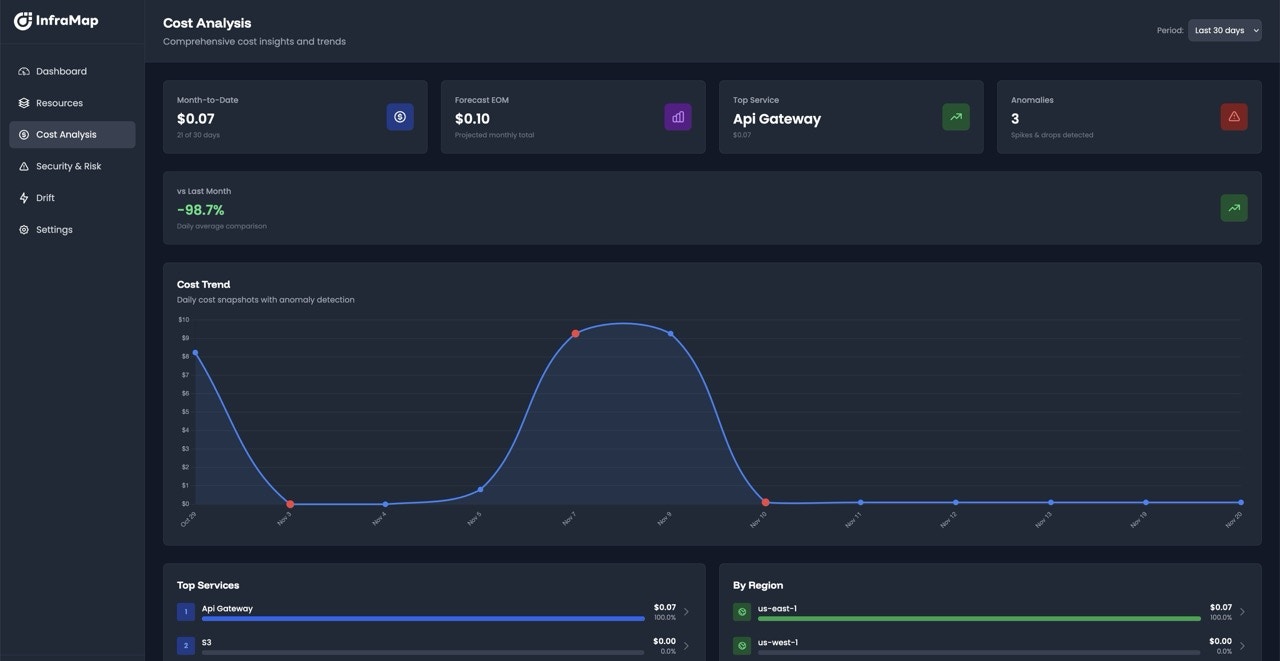 InfraMap provides comprehensive cost visibility and analysis for your AWS infrastructure. Using AWS Cost APIs, we deliver accurate cost estimates at the resource level and organization-wide, helping you understand exactly where your money is being spent and identify opportunities for optimization.
## How It Works
InfraMap integrates with **AWS Cost Explorer API** and **AWS Cost and Usage Reports (CUR)** to provide real-time and historical cost data. Our system:
* **Queries AWS Cost APIs** - Retrieves cost data directly from AWS
* **Estimates resource costs** - Calculates monthly cost estimates for individual resources
* **Aggregates organization costs** - Provides account-wide and organization-wide cost views
* **Tracks trends over time** - Monitors cost changes and identifies anomalies
* **Identifies waste** - Detects idle resources and optimization opportunities
For Enterprise plans, InfraMap can ingest Cost and Usage Reports (CUR) for even more detailed and accurate cost analysis, including advanced cost allocation and custom cost views.
## Resource-Level Cost Estimation
Every resource in InfraMap displays its estimated monthly cost. These estimates are calculated using:
* **AWS pricing data** - Current AWS pricing for each service and region
* **Resource specifications** - Instance types, storage sizes, data transfer volumes
* **Usage patterns** - Historical usage data when available
* **Cost allocation** - Pro-rated costs for resources shared across services
### Viewing Resource Costs
You can see cost information in multiple places:
* **Resource details page** - Each resource shows its estimated monthly cost
* **Resource list view** - Sort and filter resources by cost
* **Cost breakdown** - Detailed cost components (compute, storage, data transfer, etc.)
View detailed cost information for each resource in your infrastructure.
See cost data visualized in your infrastructure maps.
## Organization-Wide Cost Views
Get a complete picture of your AWS spending across all accounts and regions.
### Total Cost Overview
The cost dashboard provides:
* **Total monthly cost** - Current month's spending across all accounts
* **Cost by account** - Breakdown of costs per AWS account
* **Cost by region** - See which regions are driving costs
* **Cost by service** - Understand which AWS services cost the most
* **Cost trends** - Month-over-month and year-over-year comparisons
### Multi-Account Cost Aggregation
If you have multiple AWS accounts connected:
* **Account-level costs** - Individual cost breakdown for each account
* **Aggregated totals** - Combined costs across all accounts
* **Account comparison** - Compare spending between accounts
* **Organization-wide view** - Total cost for your entire AWS organization
* **Cross-Provider costs** - Coming soon, multi-cloud cost aggregation across different providers
## Cost Breakdowns
InfraMap breaks down costs in multiple dimensions to help you understand your spending:
### By Service
See exactly which AWS services are consuming your budget:
* **EC2** - Compute instance costs
* **RDS** - Database instance costs
* **S3** - Storage and data transfer costs
* **Lambda** - Function execution costs
* **Data Transfer** - Inter-region and internet data transfer
* **And more** - All AWS services with associated costs
### By Region
Understand geographic cost distribution:
* **Regional cost breakdown** - Costs per AWS region
* **Regional comparisons** - Compare costs across regions
* **Data transfer costs** - Inter-region data transfer expenses
* **Regional pricing differences** - See how region affects pricing
### By Resource Type
Analyze costs by resource category:
* **Compute resources** - EC2, Lambda, ECS, EKS costs
* **Storage resources** - S3, EBS costs
* **Database resources** - RDS, DynamoDB, ElastiCache costs
* **Networking resources** - Data transfer, CloudFront, API Gateway costs
## Cost Trends and Anomaly Detection
Track your spending over time and identify unusual patterns.
### Cost Charts
Visualize your costs with interactive charts showing:
* **Daily costs** - Day-by-day spending trends
* **Monthly costs** - Month-over-month comparisons
* **Yearly trends** - Long-term cost patterns
* **Forecasting** - Projected future costs based on trends
### Anomaly Detection
InfraMap automatically detects cost anomalies:
* **Sudden cost spikes** - Alerts when costs increase unexpectedly
* **Unusual patterns** - Identifies deviations from normal spending
* **Cost alerts** - Email notifications for significant cost changes (Pro and Enterprise plans)
* **Anomaly explanations** - Insights into what caused the anomaly
Cost anomalies can indicate security issues (unauthorized usage), misconfigurations, or unexpected resource scaling. Review anomalies promptly to identify the cause.
## Cost Optimization
InfraMap helps you identify opportunities to reduce costs:
### Idle Resource Detection
Automatically identifies resources that appear unused:
* **Idle EC2 instances** - Instances with low CPU utilization
* **Unattached EBS volumes** - Volumes not attached to any instance
* **Unused S3 buckets** - Buckets with no recent access
* **Orphaned resources** - Resources no longer in use
### Rightsizing Recommendations
Get suggestions for optimizing resource sizes:
* **Over-provisioned instances** - Instances that could be downsized
* **Under-utilized resources** - Resources that could be consolidated
* **Estimated savings** - Potential monthly savings from optimization
* **Action items** - Specific recommendations to implement
## Next Steps
* [View your resources](/features/resources) to see individual resource costs
* [Explore infrastructure maps](/features/maps) with cost data visualization
* [Review security findings](/features/security) that may impact costs
* [Check your plan](/getting-started/plans) to unlock advanced cost features
InfraMap provides comprehensive cost visibility and analysis for your AWS infrastructure. Using AWS Cost APIs, we deliver accurate cost estimates at the resource level and organization-wide, helping you understand exactly where your money is being spent and identify opportunities for optimization.
## How It Works
InfraMap integrates with **AWS Cost Explorer API** and **AWS Cost and Usage Reports (CUR)** to provide real-time and historical cost data. Our system:
* **Queries AWS Cost APIs** - Retrieves cost data directly from AWS
* **Estimates resource costs** - Calculates monthly cost estimates for individual resources
* **Aggregates organization costs** - Provides account-wide and organization-wide cost views
* **Tracks trends over time** - Monitors cost changes and identifies anomalies
* **Identifies waste** - Detects idle resources and optimization opportunities
For Enterprise plans, InfraMap can ingest Cost and Usage Reports (CUR) for even more detailed and accurate cost analysis, including advanced cost allocation and custom cost views.
## Resource-Level Cost Estimation
Every resource in InfraMap displays its estimated monthly cost. These estimates are calculated using:
* **AWS pricing data** - Current AWS pricing for each service and region
* **Resource specifications** - Instance types, storage sizes, data transfer volumes
* **Usage patterns** - Historical usage data when available
* **Cost allocation** - Pro-rated costs for resources shared across services
### Viewing Resource Costs
You can see cost information in multiple places:
* **Resource details page** - Each resource shows its estimated monthly cost
* **Resource list view** - Sort and filter resources by cost
* **Cost breakdown** - Detailed cost components (compute, storage, data transfer, etc.)
View detailed cost information for each resource in your infrastructure.
See cost data visualized in your infrastructure maps.
## Organization-Wide Cost Views
Get a complete picture of your AWS spending across all accounts and regions.
### Total Cost Overview
The cost dashboard provides:
* **Total monthly cost** - Current month's spending across all accounts
* **Cost by account** - Breakdown of costs per AWS account
* **Cost by region** - See which regions are driving costs
* **Cost by service** - Understand which AWS services cost the most
* **Cost trends** - Month-over-month and year-over-year comparisons
### Multi-Account Cost Aggregation
If you have multiple AWS accounts connected:
* **Account-level costs** - Individual cost breakdown for each account
* **Aggregated totals** - Combined costs across all accounts
* **Account comparison** - Compare spending between accounts
* **Organization-wide view** - Total cost for your entire AWS organization
* **Cross-Provider costs** - Coming soon, multi-cloud cost aggregation across different providers
## Cost Breakdowns
InfraMap breaks down costs in multiple dimensions to help you understand your spending:
### By Service
See exactly which AWS services are consuming your budget:
* **EC2** - Compute instance costs
* **RDS** - Database instance costs
* **S3** - Storage and data transfer costs
* **Lambda** - Function execution costs
* **Data Transfer** - Inter-region and internet data transfer
* **And more** - All AWS services with associated costs
### By Region
Understand geographic cost distribution:
* **Regional cost breakdown** - Costs per AWS region
* **Regional comparisons** - Compare costs across regions
* **Data transfer costs** - Inter-region data transfer expenses
* **Regional pricing differences** - See how region affects pricing
### By Resource Type
Analyze costs by resource category:
* **Compute resources** - EC2, Lambda, ECS, EKS costs
* **Storage resources** - S3, EBS costs
* **Database resources** - RDS, DynamoDB, ElastiCache costs
* **Networking resources** - Data transfer, CloudFront, API Gateway costs
## Cost Trends and Anomaly Detection
Track your spending over time and identify unusual patterns.
### Cost Charts
Visualize your costs with interactive charts showing:
* **Daily costs** - Day-by-day spending trends
* **Monthly costs** - Month-over-month comparisons
* **Yearly trends** - Long-term cost patterns
* **Forecasting** - Projected future costs based on trends
### Anomaly Detection
InfraMap automatically detects cost anomalies:
* **Sudden cost spikes** - Alerts when costs increase unexpectedly
* **Unusual patterns** - Identifies deviations from normal spending
* **Cost alerts** - Email notifications for significant cost changes (Pro and Enterprise plans)
* **Anomaly explanations** - Insights into what caused the anomaly
Cost anomalies can indicate security issues (unauthorized usage), misconfigurations, or unexpected resource scaling. Review anomalies promptly to identify the cause.
## Cost Optimization
InfraMap helps you identify opportunities to reduce costs:
### Idle Resource Detection
Automatically identifies resources that appear unused:
* **Idle EC2 instances** - Instances with low CPU utilization
* **Unattached EBS volumes** - Volumes not attached to any instance
* **Unused S3 buckets** - Buckets with no recent access
* **Orphaned resources** - Resources no longer in use
### Rightsizing Recommendations
Get suggestions for optimizing resource sizes:
* **Over-provisioned instances** - Instances that could be downsized
* **Under-utilized resources** - Resources that could be consolidated
* **Estimated savings** - Potential monthly savings from optimization
* **Action items** - Specific recommendations to implement
## Next Steps
* [View your resources](/features/resources) to see individual resource costs
* [Explore infrastructure maps](/features/maps) with cost data visualization
* [Review security findings](/features/security) that may impact costs
* [Check your plan](/getting-started/plans) to unlock advanced cost features